Description of monitoring alarm items
Overview
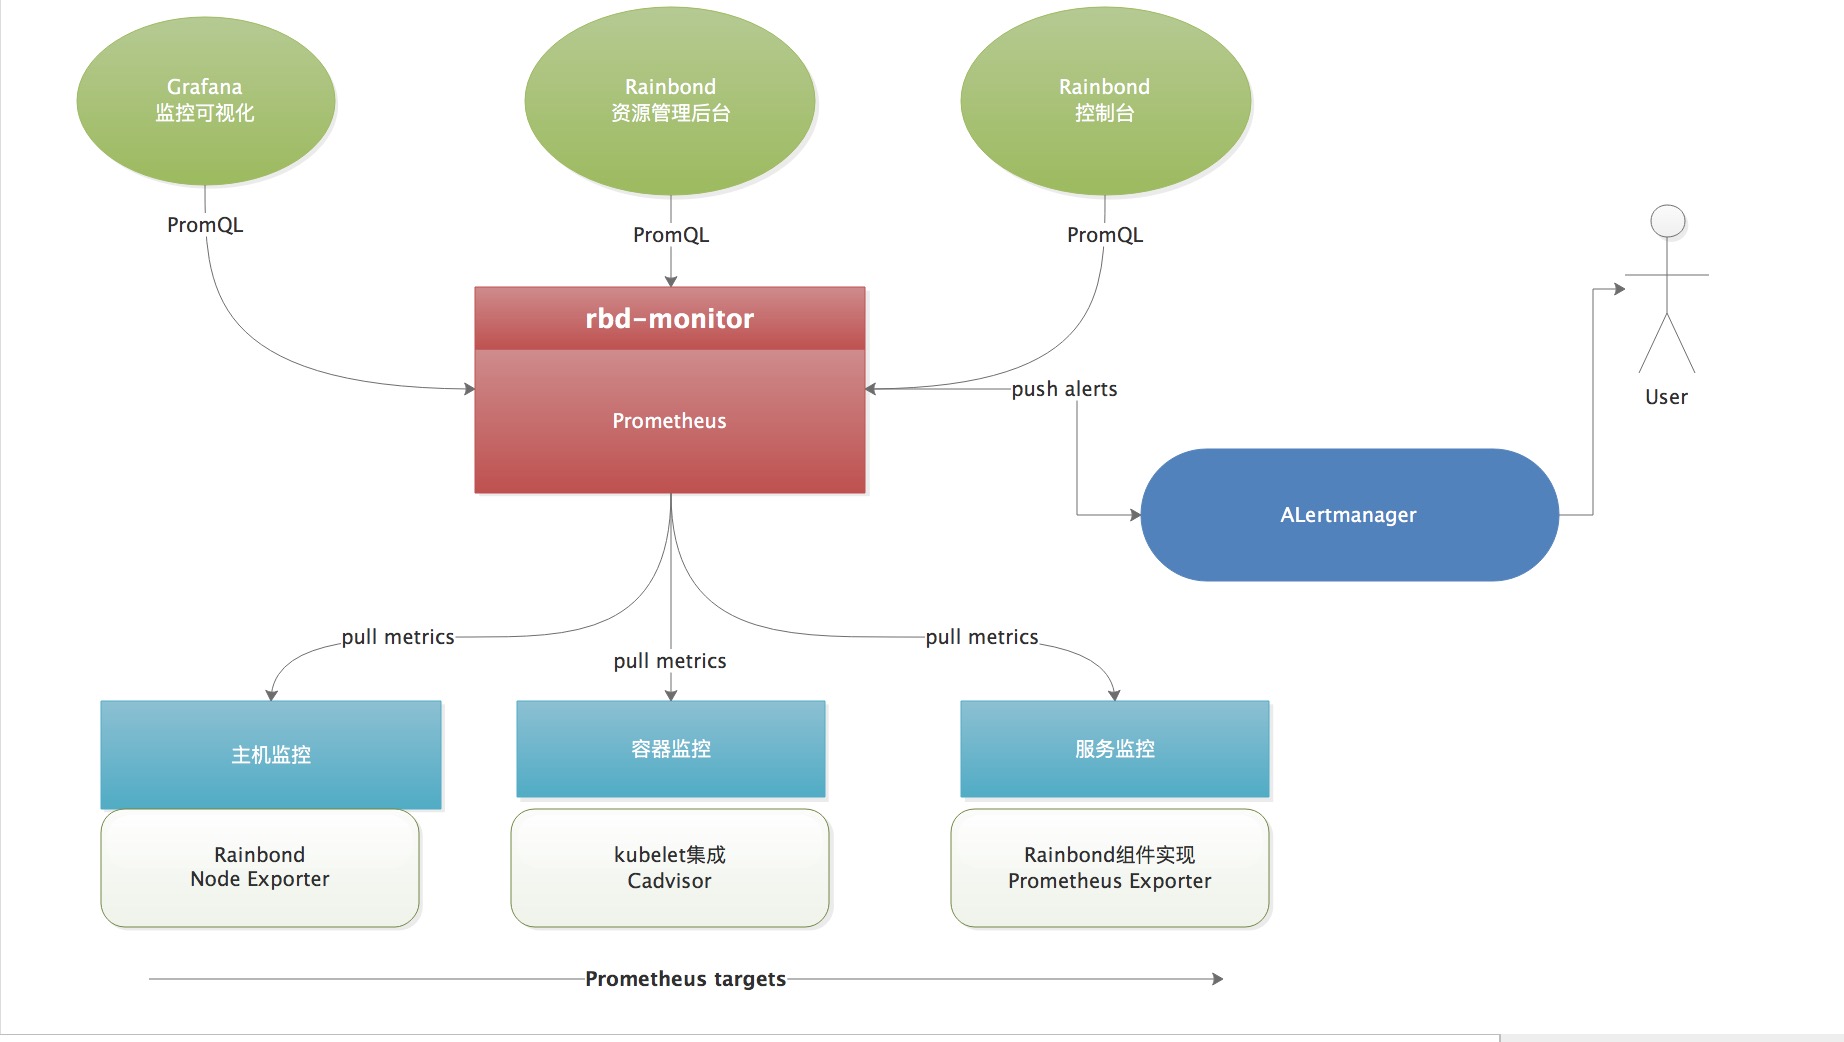
The Rainbond monitoring service is completed by the component rbd-monitor In the monitor component, the Sidecar design pattern is used to integrate the Prometheus services, and dynamically discovers the targets that need to be monitored based on etcd, and automatically configures and manages the Prometheus service.Monitor will scrape indicator data from each target regularly, and persist the data locally, providing flexible PromQL query and RESTful API query.
Architecture Diagram:

interview method
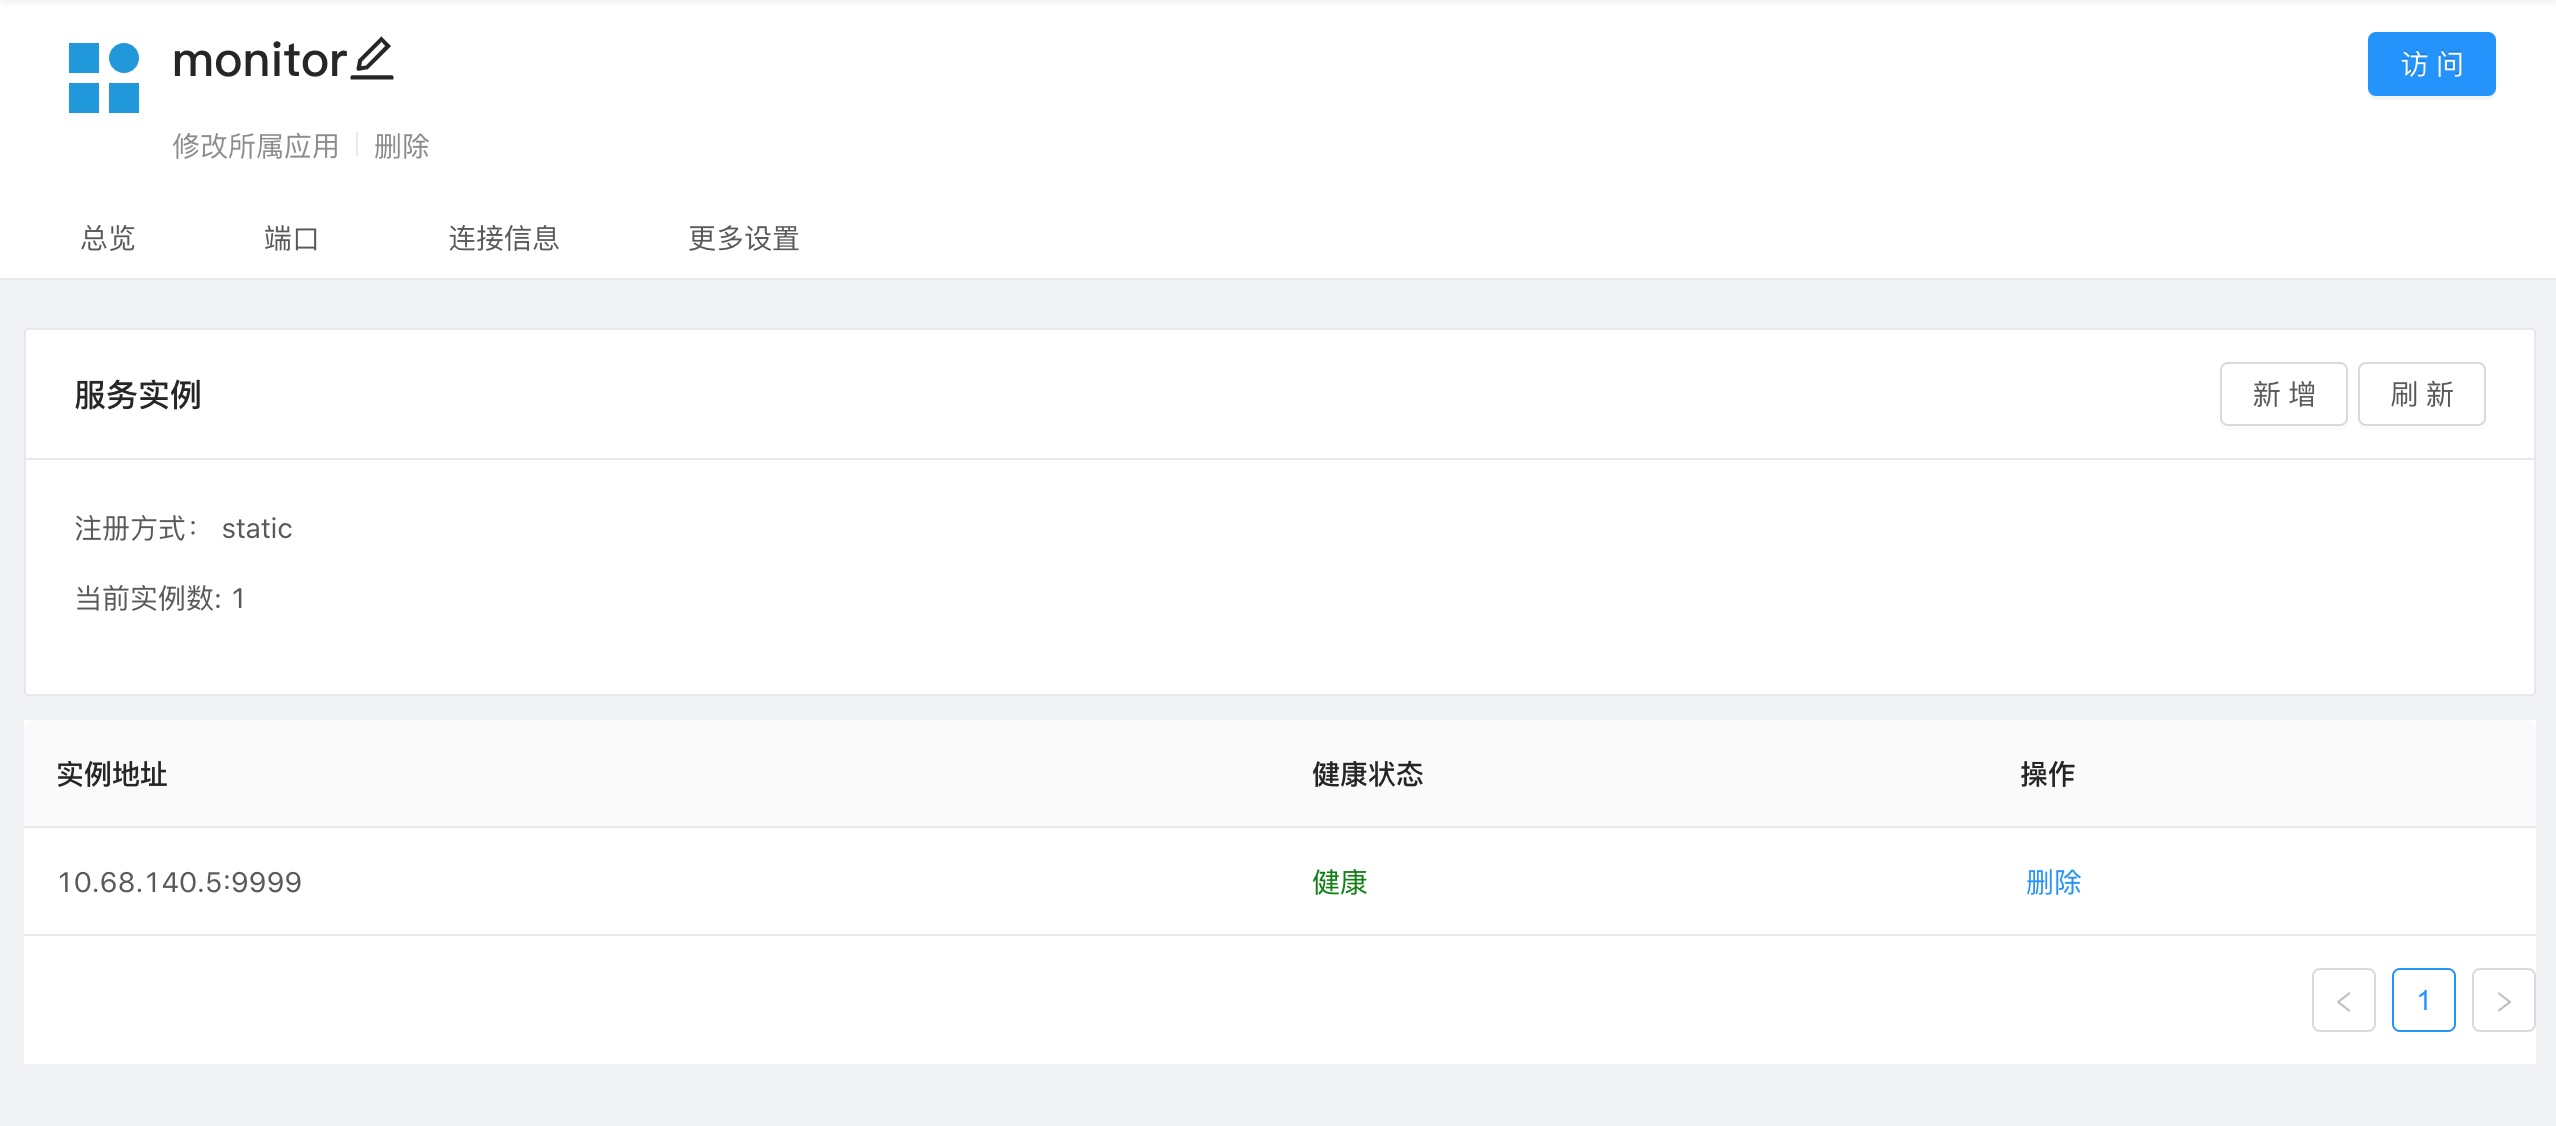
The default listening port is 9999. The default installation has added a Service object. After the cluster obtains ServiceIP , add a third-party service on the platform to open the external port to access.
Get ServiceIP way
$ kubectl get service rbd-monitor -n rbd-system
NAME TYPE CLUSTER-IP EXTERNAL-IP PORT(S) AGE
rbd-monitor ClusterIP 10.68.140.5   <none>        9999/TCP 7h11m

For specific monitoring alarm items, please visit rbd-monitor to view, the following is for reference only.
Monitoring item
Node resource monitoring items
| Monitoring item | owning component | illustrate |
|---|---|---|
| cadvisor_version_info | cadvisor | Node system information |
| machine_memory_bytes | cadvisor | Current host memory size |
| machine_cpu_cores | cadvisor | Current node CPU number |
| node_filesystem_size | node | storage |
| node_load1 | node | Load 1m |
| node_load5 | node | Load 5m |
| node_load5 | node | Load 15m |
| node_memory_MemTotal | node | Node memory total |
| node_memory_MemFree | node | Node memory free |
| node_uname_info | node | Node information |
Rainbond Service Component Monitoring Items
| Monitoring item | owning component | illustrate |
|---|---|---|
| acp_mq_dequeue_number | rbd-mq | |
| acp_mq_enqueue_number | rbd-mq | |
| acp_mq_exporter_health_status | rbd-mq | |
| acp_mq_exporter_last_scrape_error | rbd-mq | |
| acp_mq_exporter_scrapes_total | rbd-mq | |
| builder_exporter_builder_task_error | rbd-chaos | Number of source code build task failures |
| builder_exporter_builder_task_number | rbd-chaos | Number of source code build tasks |
| builder_exporter_health_status | rbd-chaos | Component status 1 is healthy |
| event_log_exporter_chan_cache_size | rbd-eventlog | |
| event_log_exporter_collector_duration_seconds | rbd-eventlog | |
| event_log_exporter_container_log_store_cache_barrel_count | rbd-eventlog | |
| event_log_exporter_container_log_store_log_count | rbd-eventlog | |
| event_log_exporter_event_store_barrel_count | rbd-eventlog | |
| event_log_exporter_event_store_cache_barrel_count | rbd-eventlog | |
| event_log_exporter_event_store_log_count | rbd-eventlog | |
| event_log_exporter_health_status | rbd-eventlog | |
| event_log_exporter_last_scrape_error | rbd-eventlog | |
| event_log_exporter_monitor_store_barrel_count | rbd-eventlog | |
| event_log_exporter_monitor_store_log_count | rbd-eventlog | |
| event_log_exporter_scrapes_total | rbd-eventlog | |
| gateway_request_duration_seconds_bucket | rbd-gateway | The number of client requests within the specified request time (bucket) |
| gateway_request_duration_seconds_count | rbd-gateway | Total number of client requests |
| gateway_request_duration_seconds_sum | rbd-gateway | Total client request time |
| gateway_request_size_bucket | rbd-gateway | The number of requests that satisfy the condition within the specified request size (bucket) |
| gateway_request_size_count | rbd-gateway | Total number of client requests |
| gateway_request_size_sum | rbd-gateway | The total number of client request sizes |
| gateway_requests | rbd-gateway | The number of client visits |
| gateway_response_duration_seconds_bucket | rbd-gateway | Within the specified response time (bucket), the number of responses |
| gateway_response_duration_seconds_count | rbd-gateway | total number of responses |
| gateway_response_duration_seconds_sum | rbd-gateway | total time to respond |
| gateway_response_size_bucket | rbd-gateway | The number of responses that satisfy the condition within the specified response size (bucket) |
| gateway_response_size_count | rbd-gateway | total number of responses |
| gateway_response_size_sum | rbd-gateway | total size of the response |
| gateway_upstream_latency_seconds | rbd-gateway | The number of delays that satisfy the condition within the specified delay time (bucket) |
| gateway_upstream_latency_seconds_count | rbd-gateway | total number of delays |
| gateway_upstream_latency_seconds_sum | rbd-gateway | sum of delay times |
| worker_exporter_health_status | rbd-worker | |
| worker_exporter_worker_task_number | rbd-worker | |
| worker_exporter_collector_duration_seconds | rbd-worker | |
| worker_exporter_last_scrape_error | rbd-worker | |
| worker_exporter_scrapes_total | rbd-worker | |
| worker_exporter_worker_task_error | rbd-worker | |
| worker_exporter_worker_task_number | rbd-worker | |
| worker_up | rbd-worker | |
| scrape_samples_scraped | ||
| scrape_samples_post_metric_relabeling | ||
| scrape_duration_seconds | ||
| statsd_exporter_build_info | ||
| statsd_exporter_events_total | ||
| statsd_exporter_lines_total | ||
| statsd_exporter_loaded_mappings | ||
| statsd_exporter_samples_total | ||
| statsd_exporter_tag_errors_total | ||
| statsd_exporter_tags_total | ||
| statsd_exporter_tcp_connection_errors_total | ||
| statsd_exporter_tcp_connections_total | ||
| statsd_exporter_tcp_too_long_lines_total | ||
| statsd_exporter_udp_packets_total | ||
| up | component status |
Application-level monitoring items
| Monitoring item | illustrate |
|---|---|
| app_resource_appmemory | Application memory, filter according to service_id, tenant_id |
| app_resource_appfs | application |
| app_resource_appmemory | application |
| app_client_request | application |
| app_client_requesttime | application |
| app_request | application |
| app_request_unusual | application |
| app_requestclient | application |
| app_requesttime | application |
Application-level acquisition of typical monitoring indicators based on CAvisor
| Monitoring item | type | illustrate |
|---|---|---|
| container_cpu_load_average_10s | gauge | Average load of container CPU over the past 10 seconds |
| container_cpu_usage_seconds_total | counter | Cumulative occupancy time of the container on each CPU core (unit:seconds) |
| container_cpu_system_seconds_total | counter | System CPU cumulative occupancy time (unit:seconds) |
| container_cpu_user_seconds_total | counter | User CPU cumulative occupancy time (unit:seconds) |
| container_fs_usage_bytes | gauge | The usage of the file system in the container (unit:bytes) |
| container_fs_limit_bytes | gauge | The total amount of file system that the container can use (unit:bytes) |
| container_fs_reads_bytes_total | counter | The total amount of accumulated data read by the container (unit:bytes) |
| container_fs_writes_bytes_total | counter | The total amount of accumulated data written by the container (unit:bytes) |
| container_memory_max_usage_bytes | gauge | The maximum memory usage of the container (in:bytes) |
| container_memory_usage_bytes | gauge | The current memory usage of the container (unit:bytes) |
| container_spec_memory_limit_bytes | gauge | Container memory usage limit |
| container_network_receive_bytes_total | counter | The total amount of accumulated data received by the container network (unit:bytes) |
| container_network_transmit_bytes_total | counter | The total amount of accumulated data transmitted by the container network (unit:bytes) |
Other monitoring items
| Monitoring item | illustrate |
|---|---|
| process_cpu_seconds_total | |
| process_max_fds | |
| process_open_fds | |
| process_virtual_memory_bytes | |
| process_start_time_seconds | |
| process_resident_memory_bytes | |
| process_open_fds | |
| process_max_fds | |
| process_cpu_seconds_total |
Description of alarm rules
Component monitoring alarm
| Alarm item | Alarm information |
|---|---|
| api service offline | APIDown |
| chaos service offline | BuilderDown |
| The state of the chaos component is abnormal | BuilderUnhealthy |
| The number of abnormal tasks in source code construction is greater than 30 | BuilderTaskError |
| ETCD service offline | EtcdDown |
| ETCD Leader node goes offline | EtcdLoseLeader |
| ETCD cluster member exception | InsufficientMembers |
| ETCD Cluster Leader Change | HighNumberOfLeaderChanges |
| ETCD GPRC failed requests greater than 0.05 | HighNumberOfFailedGRPCRequests |
| ETCD The number of HTTP request failures in 1 minute is greater than 0.05 | HighNumberOfFailedHTTPRequests |
| The number of GPRC slow queries in ETCD within 1 minute is greater than 0.15 | GRPCRequestsSlow |
| ETCD disk space occupies more than 80% | DatabaseSpaceExceeded |
| The eventlog component status is abnormal | EventLogUnhealthy |
| eventlog service offline | EventLogDown |
| gateway service offline | GatewayDown |
| The gateway request size exceeds 10M | RequestSizeTooMuch |
| The number of gateway requests per second exceeds 200 | RequestMany |
| The number of bad requests in gateway 10s is greater than 5 | FailureRequestMany |
| mq service offline | MqDown |
| The status of mq component is abnormal | MqUnhealthy |
| There are tasks longer than 1 minute in the mq message queue | MqMessageQueueBlock |
| webcli service goes offline | WebcliDown |
| The status of the webcli component is abnormal | WebcliUnhealthy |
| The number of errors that occurred while executing the command from webcli was greater than 5 per second | WebcliUnhealthy |
| worker service goes offline | WorkerDown |
| The status of the worker component is abnormal | WorkerUnhealthy |
| The number of worker task execution errors is greater than 50 | WorkerTaskError |
Cluster monitoring alarm
| Alarm item | Alarm information |
|---|---|
| Rainbond cluster node node is unhealthy | RbdNodeUnhealth |
| K8s cluster node node is unhealthy | KubeNodeUnhealth |
| It takes more than 10s to collect cluster information | ClusterCollectorTimeout |
| The tenant's resource usage exceeds the resource limit | InsufficientTenantResources |
| Node node goes offline | NodeDown |
| The CPU usage of the node is greater than 70% within 5 minutes | HighCpuUsageOnNode |
| The available memory resources of the cluster are less than 2GB | InsufficientClusterMemoryResources |
| Cluster CPU availability is less than 500m | InsufficientClusterCPUResources |
| The node load is greater than 5 within 5 minutes | HighLoadOnNode |
| The remaining available amount of node Inode is less than 0.3 | InodeFreerateLow |
| The disk usage of the root partition of the node is greater than 85% | HighRootdiskUsageOnNode |
| Node Docker disk partition usage is greater than 85% | HighDockerdiskUsageOnNode |
| Node memory usage is greater than 80% | HighMemoryUsageOnNode |
For cluster monitoring and alarm configuration, see Monitoring and Alarm Deployment