Application topology
display mode
The topology map graphically displays the real-time status of all service components of the application, and it will display information in the following dimensions:
- Component network topology
The figure can clearly show the direct network call relationship of the components and the openness of the public network. Combined with the traffic status, the communication status can be easily found.
- Component overall business dependencies
The connections between the components in the figure represent the business dependencies of the components, allowing users to know the business relationships of the complex business system at a glance.
- Component Traffic Tracking Status
Each line in the topology diagram will display the throughput rate and response time of each communication link in real time after the performance analysis plug-in is enabled. In the future, the error rate and distributed tracing will also be displayed in the link.
- component running status
The component displays the component status in color, and the corresponding relationship is as follows:
| color | not built/not started |
|---|---|
| black, grey | not built/not started |
| green | running |
| light green | during upgrade |
| red | closed |
If the component hex is superimposed, it means that the current component is running multiple instances.

edit mode
Editing the topology map currently supports: establishing or canceling dependencies for service component connections, opening or closing external ports of service components, which is convenient and fast;
- delete action
Click the connection line and press the delete button to quickly delete the component dependencies and close all external ports of the service component, which is convenient and quick;
- add action
Click and drag the focus from the start point to the end point to establish a dependency between two components or open external network access.
Aggregation mode
In the actual use of the enterprise, the components of one application often depend on the components of other applications. At this time, the topology map information seen by the user will be large and cluttered, and it is impossible to quickly distinguish the applications to which other components belong.At this time, for the user, the dependencies between multiple applications are not clear.To address this issue, we have added a topology graph aggregation mode.In this case, the dependencies between multiple applications can be displayed more clearly.
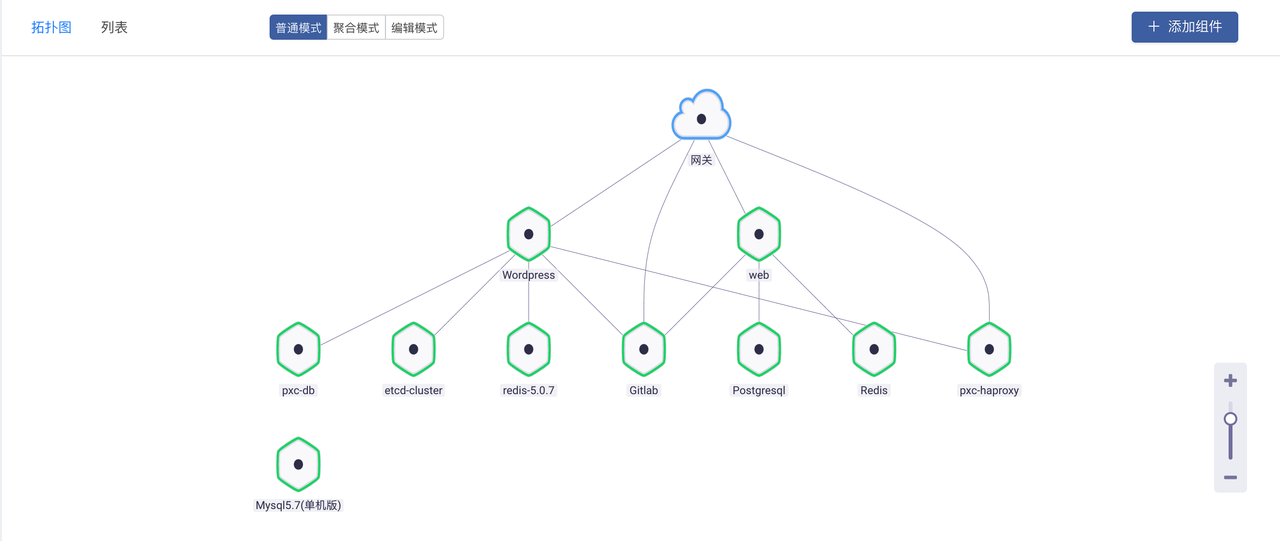
In normal mode, you can see that the application depends on multiple components, but we are not clear about the relationship between these components.
We switch to aggregation mode, and we can see that the relationship between components and other applications is clear.
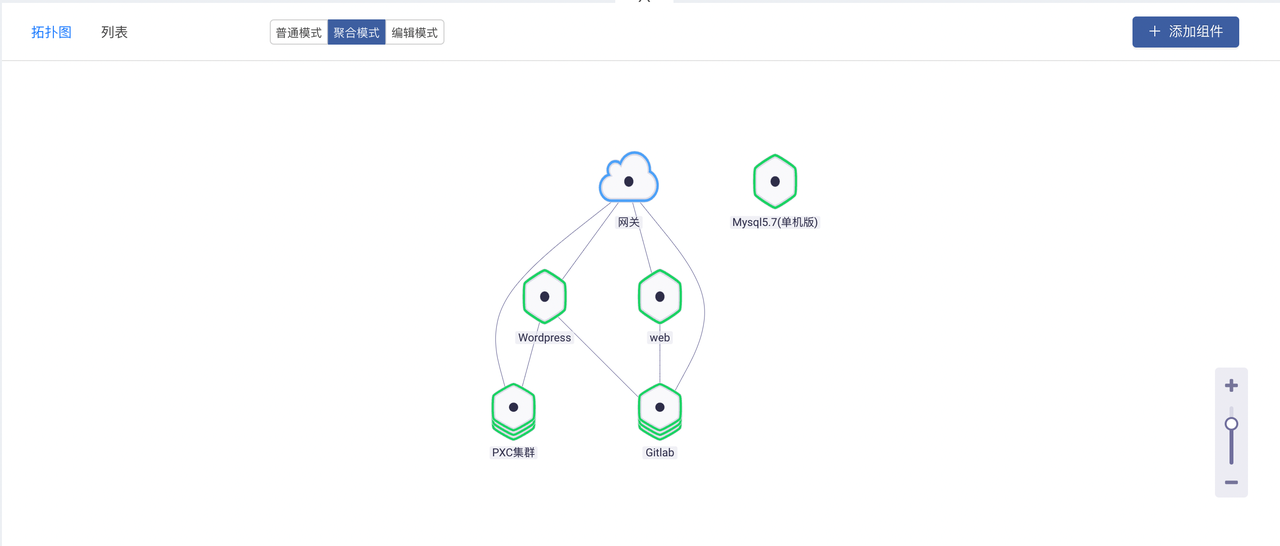
Click on the topology map of the Gitlab application, we can know the running status of the application and the information of the dependent components.
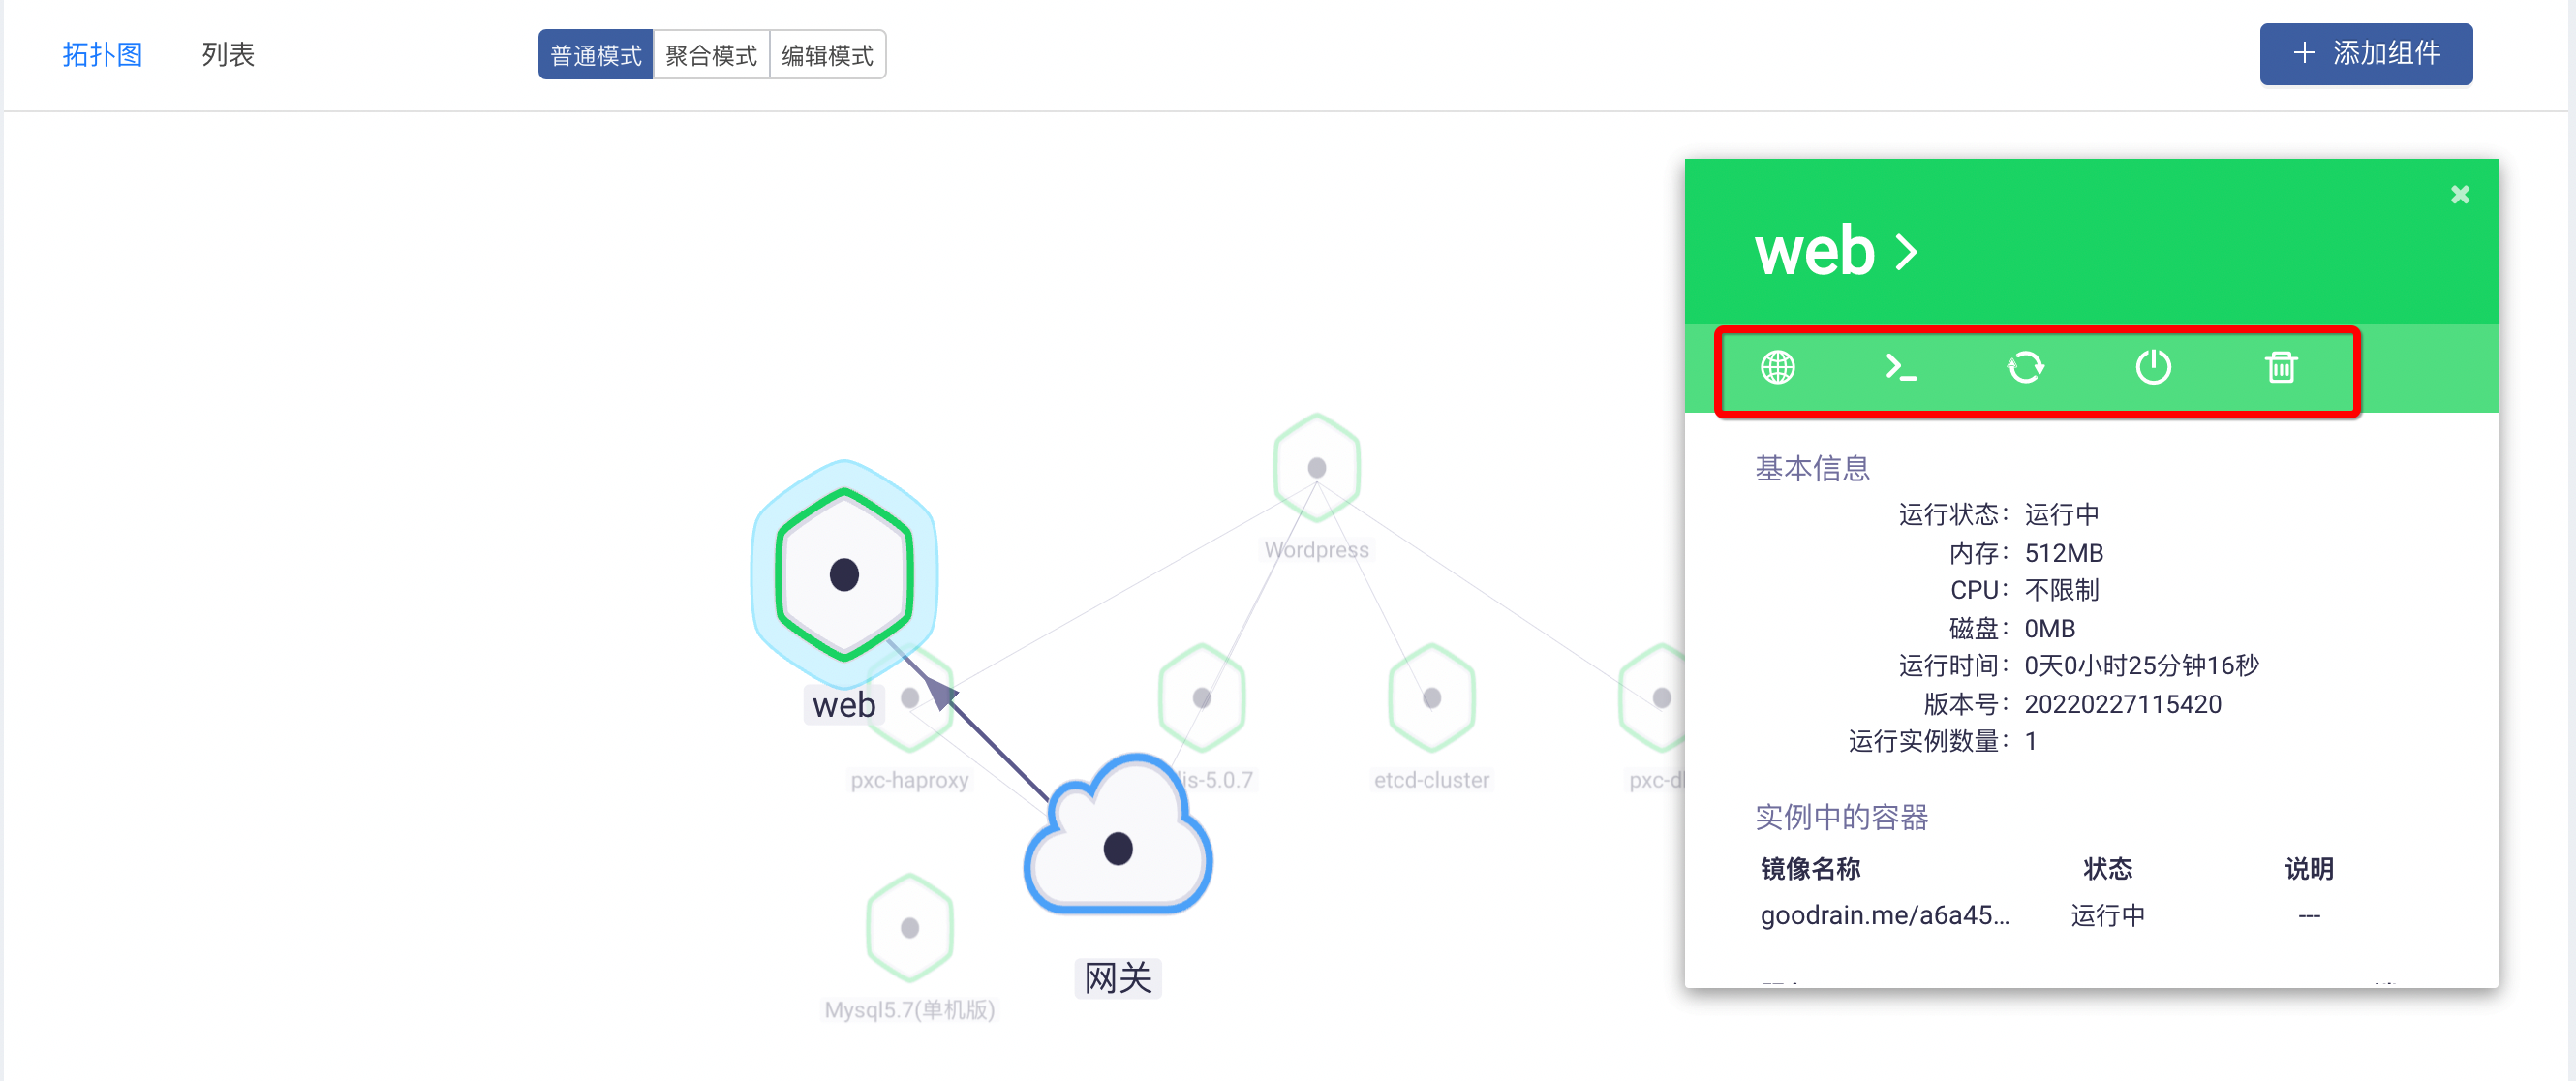
Topology Component Operations
By clicking on the component, the user can perform cluster operations on the component in the pop-up component basic information box, including accessing the component, entering the Web terminal, updating the component, closing the component, and deleting the component.Users can quickly operate the component according to these buttons, and the container information in the component is displayed below.